

004. COVID, Mental Health, and Social Media - Part I
004. COVID, Mental Health, and Social Media - Part I

It is not a surprise that the COVID-19 pandemic exacerbated the mental health of a great many: lockdown, quarantine, fear of health problems, economic and financial hardship, and other factors all contributed to anxiety, depression, and stress (Salari et al., 2020). While many cathartic outlets for these mental issues exist, an increasingly popular one is social media (Skaik & Inkpen, 2020). People seek empathy and condolences from online peers (Zhou & Jurgens, 2020) and receive social support with animosity (Choudhury & De, 2014). Therefore, it is predictable that online communities about mental health thrived during the pandemic and became the online space for sharing their personal struggles during COVID and seeking help from others.
Indeed a body of scholarly work that focuses on monitoring, detecting, and surveilling COVID-related mental issues has surfaced in the last few years (Abbas, Wang, Su, & Ziapour, 2021; Gao et al., 2020; Low et al., 2020). They applied an array of methods, including and not limited to text analysis, machine learning, and deep learning, to trace the trend of people’s mental well-being during COVID, the correlation between COVID and mental health, and the content and context of the COVID-related mental health issues. Recognizing the effort and quality of these existing works, here I don’t intend to repeat their analytical procedures or replicate their research findings. However, in light of methodological improvement, I do want to answer some of the research questions using alternative approaches:
Are there relationships between the popularity of mental health social media and COVID cases?
This is a general question that investigates whether user participation on mental health online platforms was boosted by the pandemic, as COVID was expected to bring tremendous turbulence to people’s normal lives. The current research did use visual analytics to show the interplay of COVID and platform activities, but there is a lack of sophistication: the effect of the pandemic might not be instant—it could take some time for us to see the effects if any. To render more nuanced findings, one needs to consider the lagging effects of the pandemic. To achieve this, I plan to use time-lagged cross-correlation (TLCC) to compute the correlation between the COVID cases and the user participation metrics of mental health platforms.
Are there relationships between the popularity of COVID-related mental health posts and COVID cases?
This question delimits the scope of analysis from the entire corpus to the posts that are specifically related to the pandemic. Common practices in existing research used a keyword matching strategy, which is a standard way to pinpoint the posts of interest. However, when analyzing the trend, there is still a want of considering time-lagged effects. Therefore, the same TLCC techniques are expected to be used for this question as well.
Did drug abuse become more prevalent on social media during the pandemic?
Here we further quantify the question to the topic of drug abuse: pointing to a specific risky behavior that might be entailed by mental health problems. Amongst the publications that dabbled on this question, they used a keyword list of drugs, but the drug name list was very limited. Here I will use a more comprehensive list of drugs and more importantly, their street names, to trace these posts.
Another question that is yet to be answered by current researchers is the amount of the drug that was consumed by users. Understanding the type of drug and the amount taken is a step forward to analyze the severity of drug abuse. For this part, some keyword/phrase matching will be used for detecting the words that give us some clue on this information.
Besides all the proposed methodological advancements, I used a dataset that is slightly more updated than what was used in extant research. Covering a longer span of time (late 2019 to Dec. 2021), we might be able to catch the trend of the later COVID outbreaks and their influence.
Several operational definitions are also needed for this analysis. First of all, by going with the word “relationship” in my questions, I’m loosely referring to the broad idea of correlation, and association, and not necessarily causality. Causal inference requires for more rigid research design and techniques than this blog post intended to do. Also, the online social media for mental health in my analysis are r/depression, r/anxiety, and r/suicidewatch. These three are popular mental health subreddits that were often used in social media research focusing on mental health. About the COVID data, I used the data source from DataHub.io[1]. Lastly, I did aggregate the data as a monthly summary. This was conducted mainly to avoid unnecessary segregation of data that would otherwise be based on 12 AM every day.
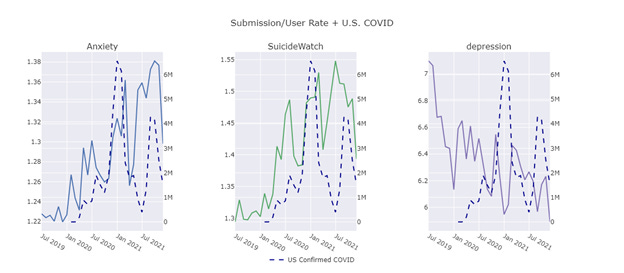
For the first question, which relates to the user participation metrics, I will examine the activity level of a subreddit from two lenses: the post-level and user-level. For the post-level, we can easily plot the number of submissions and comments of the selected subreddits.
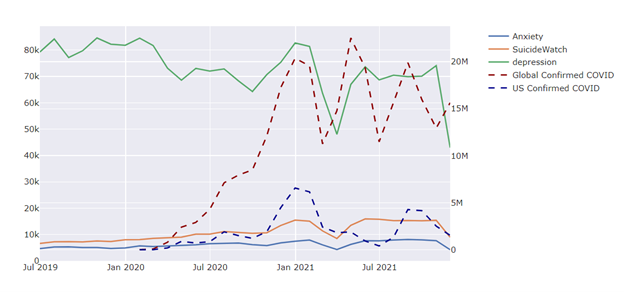
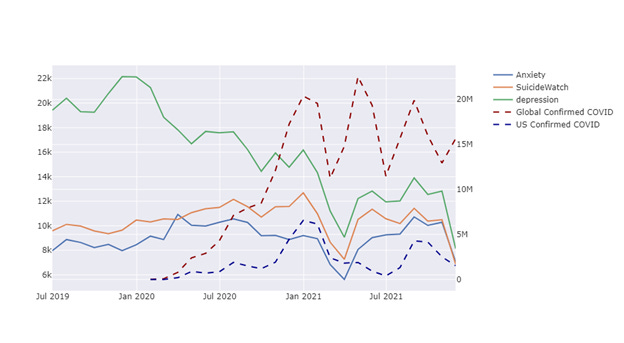
As shown in Figure 1, in terms of the overall volume of original posts, r/depression gained the highest popularity, while r/suicidewatch followed next and r/anxiety was the last one. There is a noticeable increasing trend for r/suicidewatch and r/anxiety, but r/depression is another story whose count of submissions slightly nudged downwards over time. We can also see the peak of COVID confirmed cases in the summer of 2020, which also coincided with the time when the number of submissions was at its height. The nadir in the winter of 2021 was both observed for COVID cases and the subreddit posts count. It’s interesting to see that the resurge during the summer of 2021—globally except in the U.S.—also overlaps with the increasing trend for the number of submissions.
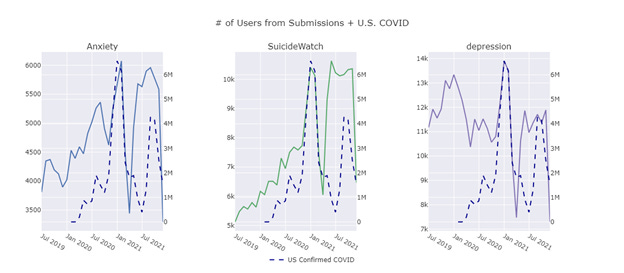
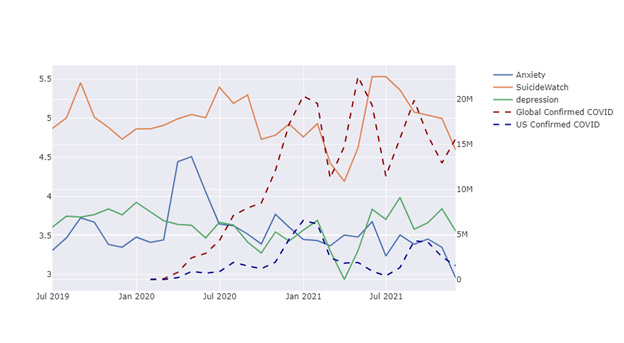
It’s worth noting that the scale of the plot might downplay some of the fluctuations for the subreddits that were less active, so I also generated facet plots with independent scales. Figure 2 shows the facet line plot of the number of submissions and the global COVID confirmed cases. The number of cases and the number of submissions synchronized pretty well for three subreddits, especially after Sept. 2020 and before Aug. 2021. After this, the number of submissions plateaued while the confirmed case count dropped and fluctuated in a more volatile fashion.

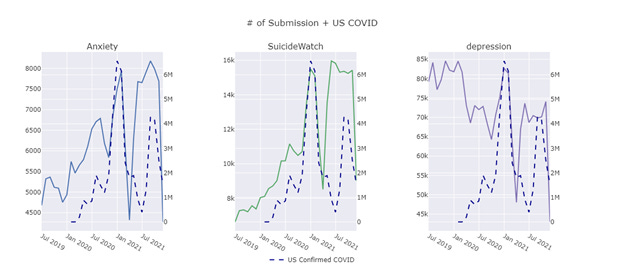
When comparing the COVID cases with the U.S. confirmed cases instead of the global statistics, we do see a similar synchronous pattern but the magnitude is different. As Figure 3 is shown, the outbreak of COVID cases in late 2021, was a smaller peak compared with early 2021; however, the count of submissions rebounded to a record high.
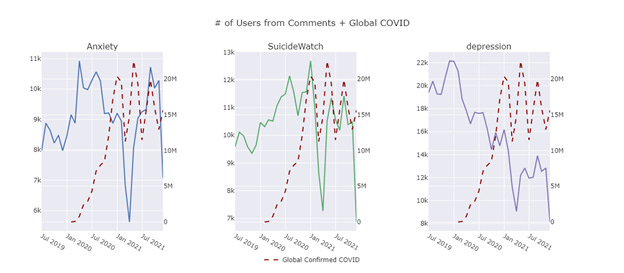
We repeated the same process for the number of comments. Figure 4 shows the number of comments on monthly summary statistics overlayed with COVID confirmed cases. We observed more randomness in the evolution of comment activity. Nonetheless, we still see some alignments of the two, especially around early 2021 when the new cases—so as the number of comments—surged and plummeted quickly during that period.
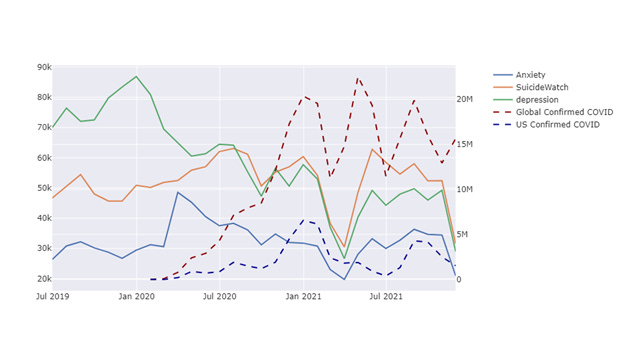
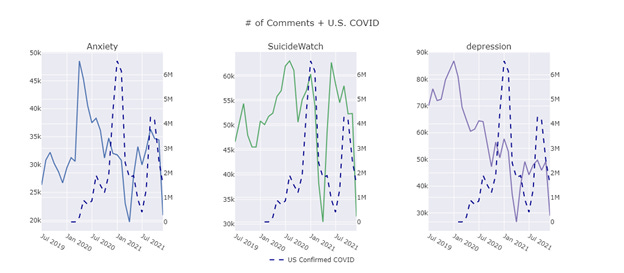
Figure 5 and Figure 6 show the comparison between comment activity and COVID cases by selected subreddits. The similarity between the count of COVID confirmed cases and comment count is larger for global COVID cases than that of the U.S. The COVID cases for the world were high around April 2021 but not so much for the U.S., but the number of comments rocketed to a high level for r/suicidewatch and r/anxiety anyhow.

The next analysis focuses on the users. We are interested in how many users actively participating in the online discussion on these mental health subreddits, given that the number of submissions and comments can be spammed by a relatively small number of users.
At first, we started with the number of users that ever posted submissions on our selected subreddits. Figure 7 shows the overall trends of the number of submission posters and the COVID cases. Compared with the number of posts, the trend line of the number of users is more stable over time, except for r/depression. The number of users who posted submissions was already high before covid, and the other two subreddits witnessed a clear upturn after COVID—and that also closely followed the trend of the COVID confirmed cases.

Figure 8 and Figure 9 also show us how the two metrics interplay. We can observe a striking similarity between the trends of COVID cases, especially the global one, and that of the number of users from r/anxiety and r/suicidewatch. The three major peaks of global COVID confirmed cases can also find their counterparts in the number of submission posters in the data for r/suicidewatch.

Again, we examined the metrics for the users who ever left comments on these mental health subreddits. The count of users for this category varied a lot, with the same erratics numbers—just as the number of comments—as shown in Figure 10. The number of users who commented on r/depression was overall decreasing throughout the selected period, which echoed the decreasing trend of the number of comments in r/depression, and further, the user count gap between the three subreddits was closing. However, the number of comments from r/suicidewatch surpassed that of the r/depression, but the number of users who posted comments didn’t.
The facet plots below also unravel the complexity of the trends. It’s not clear whether the user count of comments and COVID cases are deeply connected, especially for r/depression. Also, in Figure 12, around July 2021 when the U.S. covid case count was low, the number of users who commented is quite high, showing an ambiguously negative correlation. It’s quite perplexing how this phenomenon happened, but it leads to the next series of plots where we can normalize the data to see the number of posts per user.

In Figure 13, the discrepancy between r/depression and the other two is very prominent. The number of submissions per user fluctuated around six for r/depression but only centered around one for the other two. It’s surprising to see a user posted at multiple submissions per month for a subreddit, which might imply a strong user cohesion in terms of creative content or a series, never-resolved mental issues that prompted a user to post multiple times within a month. On the other hand, the number for r/suicidewatch and r/anxiety pronounced the one-off nature of posting—users who posted on these two subreddits didn’t linger for a long time—at least you won’t see them again within a month.
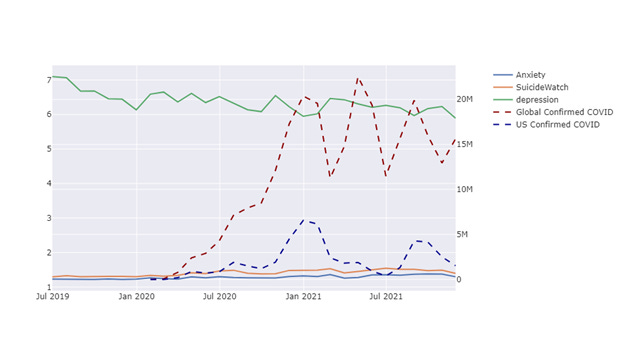
If we take a closer look at Figure 14 and Figure 15, you can see that submission per user is climbing for r/anxiety and r/suicidewatch but ebbing for r/depression. The trend of COVID case count has slightly approximated the trends for r/anxiety and r/suicidewatch but not very much for r/depression. Actually, the r/depression trend somehow resembled the count of users who commented on r/depression we saw above.

The number of comments per user, however, showed a differing picture. Comments per user in r/suicide notched top, not r/depression as like in previous plots. Overall, the user activity of commenting is more frequent with all three metrics scored larger than three. It might link to the nature of comments as they are more casual and low-effort than submissions.
Comparing COVID cases against the comment per user in Figure 17 and Figure 18, it’s also hard to eyeball any pronounced similarities between the two. The only exception might be the comment per user for r/anxiety and the global COVID cases, but still, the relationship between the two seems feeble at best.
Wrapping up this post, I want to highlight several take-aways:
On the post-level, the change in user participation on online mental health subreddits was in sync with the covid cases, especially for the submissions. We might be able to stipulate that the pandemic did boost the popularity of the mental health subreddits, which also agree with similar research (Low et al., 2020). For submissions, specifically r/suicidewatch and r/anxiety, the synchrony was observable since 2020. For comments, the most obvious concurrency didn’t happen until the end of 2020. Also, these post-level metrics are more in line with the global COVID cases count than the U.S. one. This is also understandable because even though users from the U.S. are the majority, they didn’t take up half of the user pool (“• Reddit: Traffic by Country | Statista,” n.d.).
The user-level statistics are comparable with the post-level one. The number of users who posted submissions also relates to the COVID case count, especially the global COVID cases. The only thing that stands out is the number of comments for r/depression is decreasing over time. Given the high volume of submissions being posted on r/depression, there might be a lopsided user interaction pattern emerging r/depression—more people posted while fewer people commented and the overall interaction level of post commenting is diminishing over time.
The number of posts per user is telling another story. Since the pandemic, the number of posts per user for r/anxiety and r/suicidewatch was increasing while for r/depression it was dropping. The former two were more aligned with the trend of global case count. It seems like r/depression was enjoying a surge of new users who didn’t post a lot while the other two are slowly developing its communities that have users consistently posting online. The number of comments per user for all the three subs quite deviated from the COVID case trajectory, but r/suicidewatch users posted way more comments per user than the other two. There seems to be a group of active users who enjoys commenting on r/suicidewatch and possibly the users in r/suicidewatch are more characterized by providing social support than the other two.
After this post, we will continue the exploration of this dataset and focus on the COVID-related posts and comments for inferring user participation and community activity. Also, we will bring up TLCC for a more rigid analysis of the relationship between the covid cases and the user participation.
References
• Reddit: Traffic by country | Statista. (n.d.). Retrieved May 7, 2022, from https://www.statista.com/statistics/325144/reddit-global-active-user-distribution/
Abbas, J., Wang, D., Su, Z., & Ziapour, A. (2021). The Role of Social Media in the Advent of COVID-19 Pandemic: Crisis Management, Mental Health Challenges and Implications. Risk Management and Healthcare Policy. https://doi.org/10.2147/RMHP.S284313
Choudhury, M. D., & De, S. (2014). Mental Health Discourse on reddit: Self-Disclosure, Social Support, and Anonymity. Eighth International AAAI Conference on Weblogs and Social Media. Presented at the Eighth International AAAI Conference on Weblogs and Social Media. Retrieved from https://www.aaai.org/ocs/index.php/ICWSM/ICWSM14/paper/view/8075
Gao, J., Zheng, P., Jia, Y., Chen, H., Mao, Y., Chen, S., … Dai, J. (2020). Mental health problems and social media exposure during COVID-19 outbreak. PloS One. https://doi.org/10.1371/journal.pone.0231924
Low, D. M., Rumker, L., Talkar, T., Torous, J., Cecchi, G., & Ghosh, S. S. (2020). Natural language processing reveals vulnerable mental health support groups and heightened health anxiety on reddit during covid-19: Observational study. Journal of Medical Internet Research, 22, e22635.
Salari, N., Hosseinian-Far, A., Jalali, R., Vaisi-Raygani, A.-A., Rasoulpoor, S., Mohammadi, M., … Khaledi-Paveh, B. (2020). Prevalence of stress, anxiety, depression among the general population during the COVID-19 pandemic: A systematic review and meta-analysis. Globalization and Health. https://doi.org/10.1186/s12992-020-00589-w
Skaik, R., & Inkpen, D. (2020). Using social media for mental health surveillance: A review. ACM Computing Surveys (CSUR), 53, 1–31.
Zhou, N., & Jurgens, D. (2020). Condolence and empathy in online communities. Proceedings of the 2020 Conference on Empirical Methods in Natural Language Processing (EMNLP).
[1] https://datahub.io/core/covid-19#data-cli
Cover Imge from Flickr @saulalbert