

005. Understanding the Field of Computational Social Science: A Bibliographic Analysis
005. Understanding the Field of Computational Social Science: A Bibliographic Analysis

Introduction
This is not a social media analysis like what had been posted here previously. Instead, this is my journey to understand the field of computational social science (with a focus on social media analysis) in a computational social science way. This analysis is more or less similar to any bibliographical analysis you can read in a journal—but not as rigorous as a journal paper would be.
Taking a step back, I want to first acknowledge the nature of these research papers in the field: they are the product of scholarly communication. Thus, the way I frame this analysis, the scope and the objective, with a mindset of understanding scholarly communication. When we talk about scholarly communication, we have two assumptions or qualifications: first, these research papers are of “a participle group of people” and second, of “a particular kind of goal-oriented activity” (Borgman and Furner). Bearing these in mind, this post will investigate:
Who are the group of people in this field? How do they collaborate?
What are they trying to communicate through these papers?
For the first question, I will look at the author and their affiliations, along with the collaborations. For the second part, I’d use keywords to approximate the key ideas the papers want to communicate. In addition, I’d also add the spatial and temporal dimensions to the questions, so the questions are not only answered using all papers, and treating them equally, regardless of when and where they were produced, but also answered considering the spatial-temporal complexities.
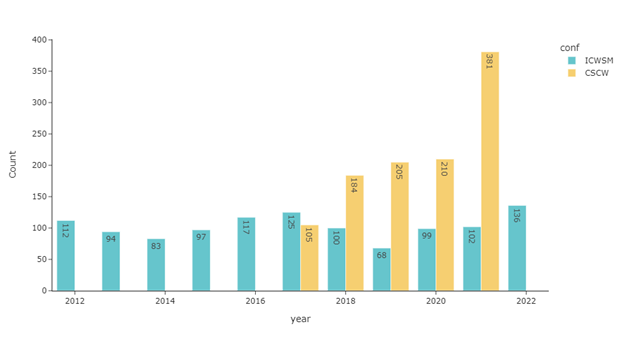
I chose to collect the publication metadata of ICWSM and CWCS, two premiere venues that are closely related to my interested field. I scraped the AAAI library for all ICWSM proceedings and the ACM library for the CWCS proceedings (all CWCS issues from the Proceedings of the ACM on Human-Computer Interaction). Scraping CWCS from the ACM library was way harder because of the rate limit (RIP my banned IP address), the dynamic content generation mechanism by JavaScript, and infinite scrolling. For each paper, I collected their title, author information, keywords (or index), and abstracts, if available. The ICWSM datasets (N = 1113) have publications dating back to 2012 and CWCW (N = 1085) 2017. Note that for ICWSM I didn’t distinguish the type of publications, so the number counted not only the full paper, but also short papers, posters, dataset papers, and demonstrations. I also dropped editorial publications from the proceedings, including editor’s notes or executive summaries. There are no duplicated entries in my dataset except for one research which was initially published on ICWSM as a short paper in 2018 but later published as a full research article on CSCW the following year. The yearly distribution of the publication count from these two conferences is shown in Figure 1. Note that I do recognize the periodicity of CSCW publication is different from ICWSM, but they are nonetheless rescaled on a yearly basis for visualization purposes.
Authors & Institutions
To answer the first question, we need to have data on the author, affiliation, and location. Author data from CSCW can be easily scraped from the web page of each article. The author line string is relatively clean for different elements are split by the comma. I extracted the content before the first comma as the institution and the last as the country. For all the available data I can scrape, all papers had been authored 4328 times by 198 authors.
For ICWSM, there is no structured way the author metadata was entered (hey, we really need that to be fixed, AAAI!). For some records, the author will leave the affiliation with other geospatial data. In that case, state information, if affiliation is in the U.S., and country name if the affiliation is outside the U.S. However, there are also many cases where the author only provided the institution name, regardless of its location, especially for authors from the industry. To obtain data for spatial analysis, I further geocoded the author affiliation data. For every affiliation entry, I used Nominatim, an open-source geocoding service to geocode it and get its country information. If Nominatim failed to fetch any results, I then used the geocoder from TomTom to repeat the process. Again, I acknowledge that the geocoding using pure affiliation data might be tricky, but at least the accuracy of the country is more robust. Of all 2,709 authors from ICWSM, 2576 authors’ affiliation was geocoded by at least Nominatim or TomTom. I also manually added some unmatched ones. After this, only 152 authors’ country information was still unknown.
Number of Authors per Paper
Figure 2 shows the trend of the number of authors per paper. Despite some large numbers observed in ICWSM, the majority of the papers have around three authors. The distribution for CSCW is even more stable with fewer values deviating from the peak of the curve. The majority of CSCW papers have around 3 to 4 authors as well. These numbers are more closely with Sciences fields than social sciences and humanities, which average around 1.6 authors per paper (Harzing).
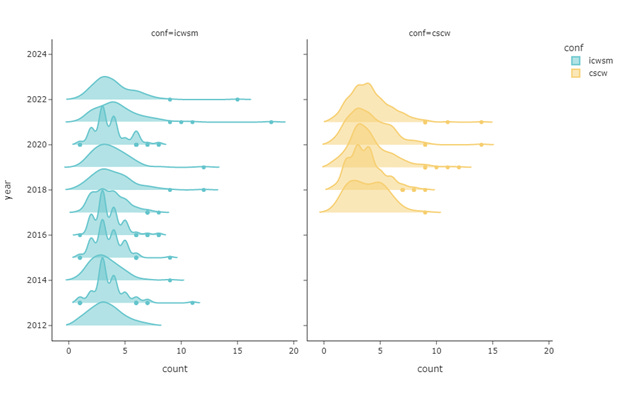
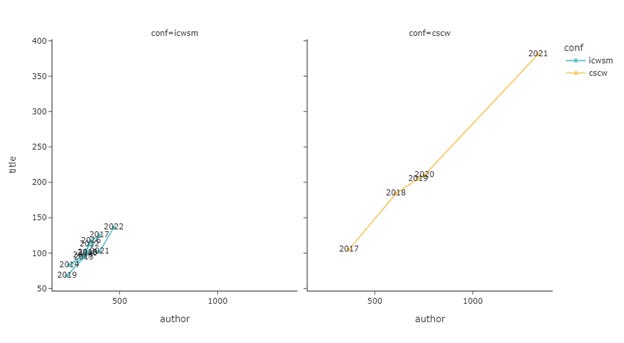
Figure 3 shows the evolution of the number of unique authors plotted against the number of papers per year. There are two things to highlight here. First of all, the volume of CSCW has been rapidly expanding while ICWSM’s barely nudged. Despite this difference, the two have a very similar pattern in terms of authors per paper. With a similar slope, the growth of included authors and papers has been increasing at a similar speed. There is no outstanding increase in the paper count for a year while at the same time the author's count lagged behind.
Yearly Publication Count per Author
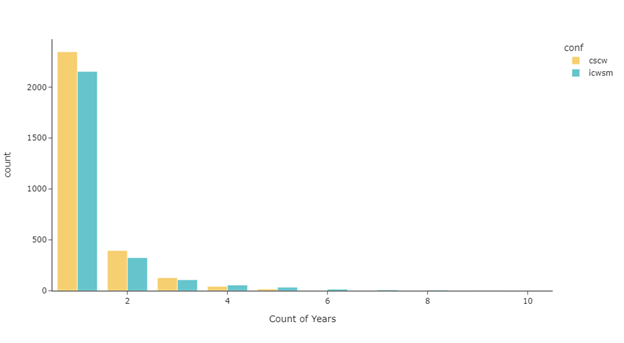
Figure 4 shows how many years an author published any articles on CSCW or ICWSM. Although we only have 5 years’ data on CSCW, the two distribution mirrors each other well. Most of the authors published once across the years: 79.5% of the authors from ICWSM and 80.1% of authors from CSCW had only had publication(s) for one year. 18 authors have publications on CSCW every year from 2017 to 2021. One author made the name on the ICWSM proceedings for consecutive 10 years.
The table below shows the authors that have published on CSCW or ICWSM for at least four years in our dataset.
Table 1 Authors with Perper on CSCW for Five Years

Table 1 Authors with Perper on ICWSM for Five Years
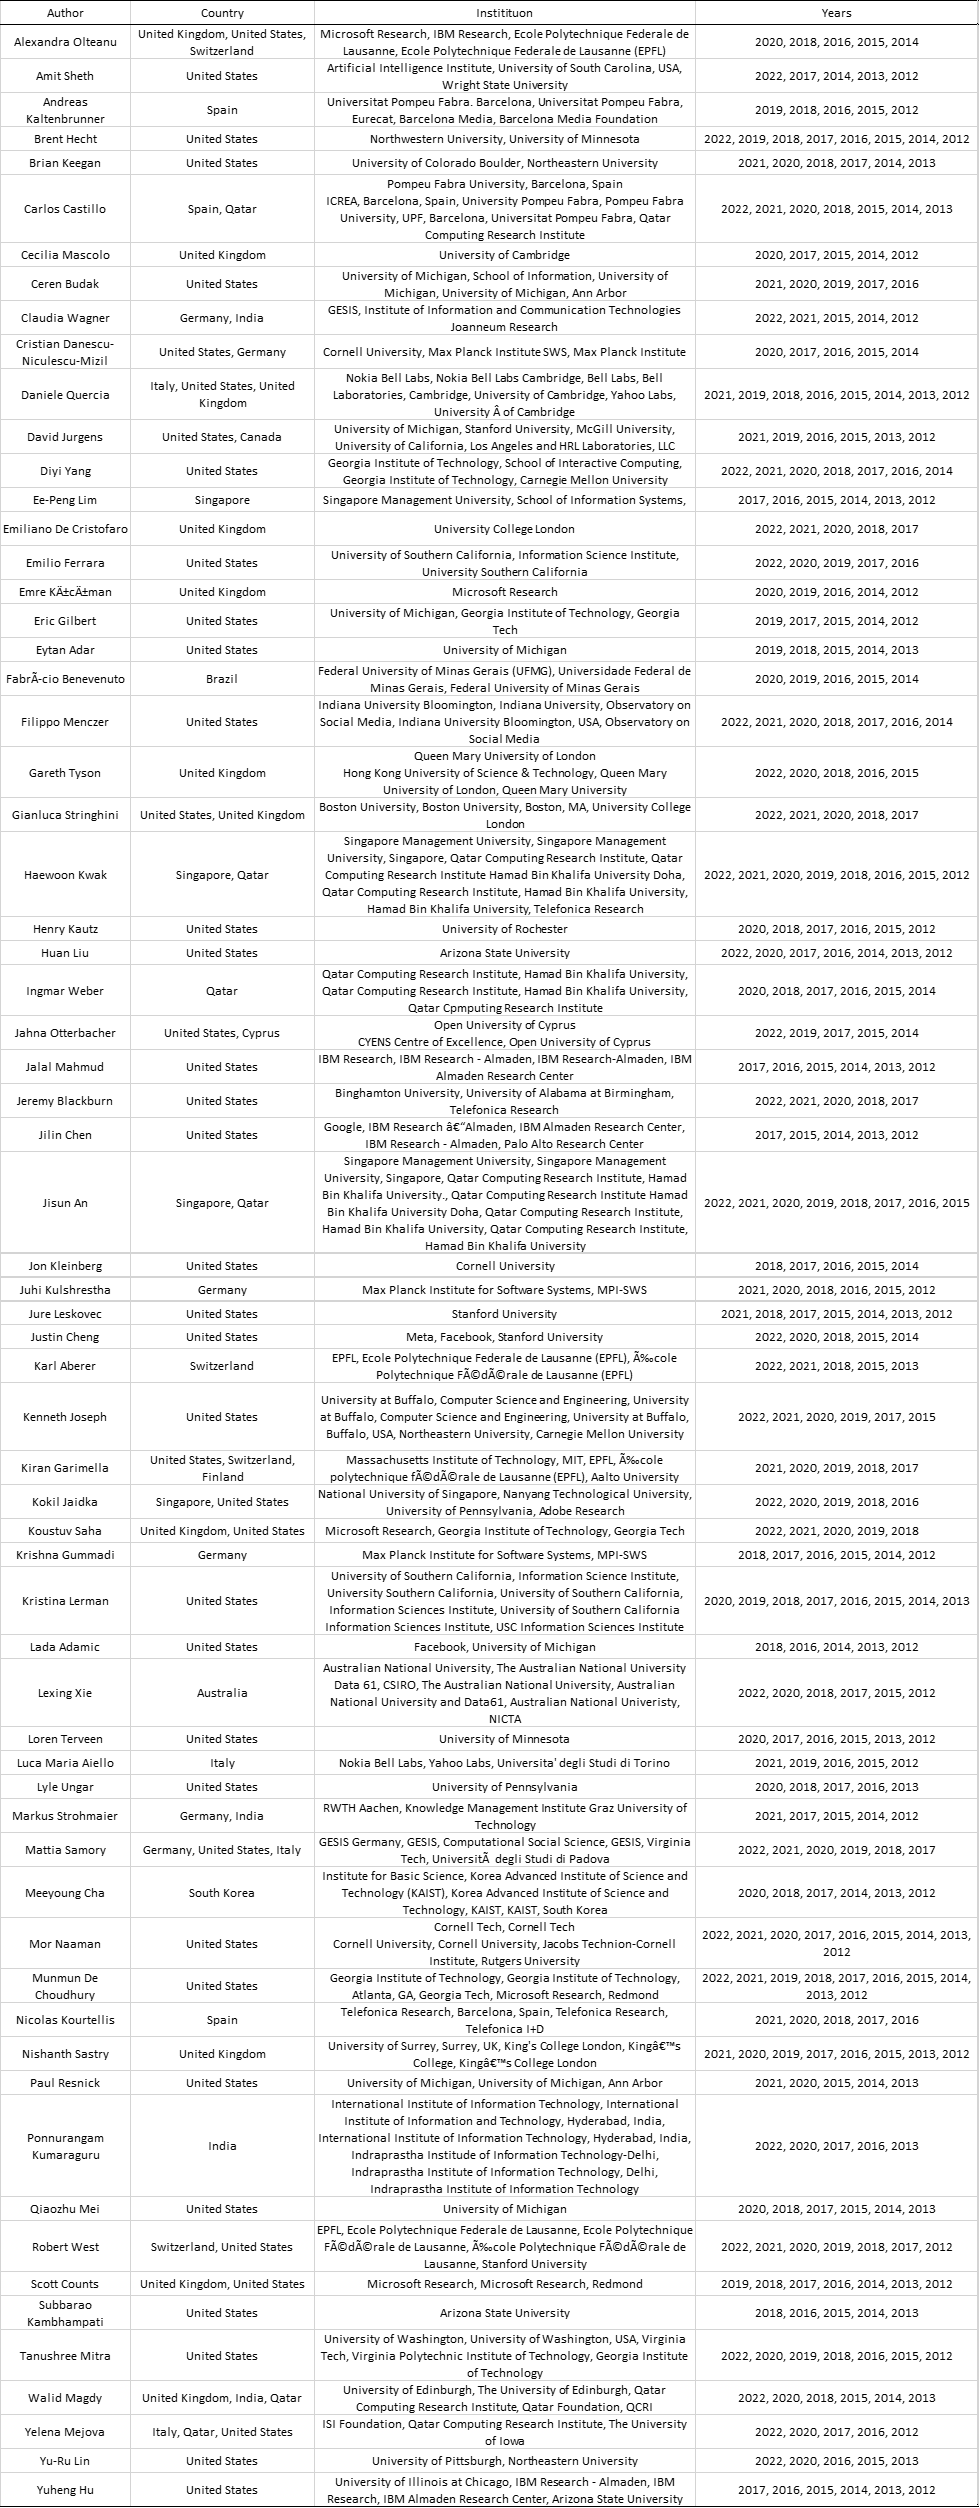
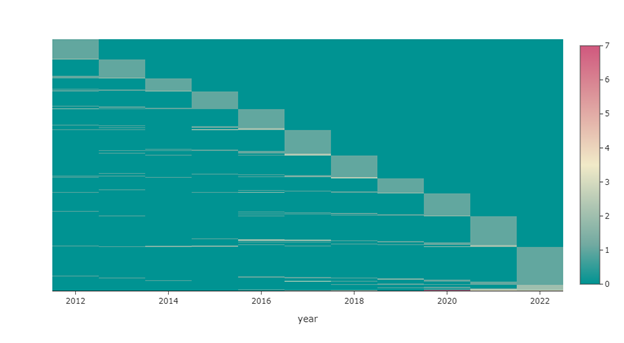
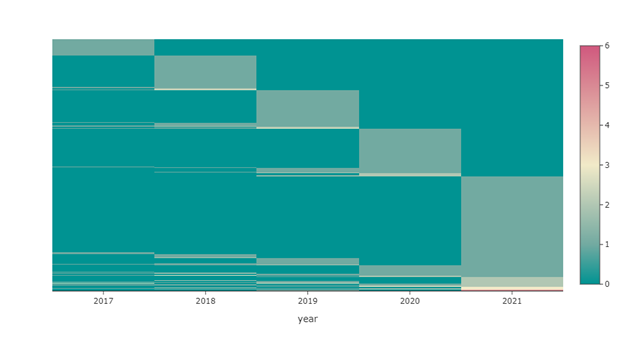
Figure 5 and Figure 6 visualize the number of papers each author published per year on ICWSM and CSCW respectively. Lighter color indicates more publications and horizontal lighter lines implied the author published at this conference consecutively. For ICWSM, we can roughly see some authors published on ICWSM around 2012 and 2013, skipped on around 2014 or both 2014 and 2015, and returned publishing on ICWSM for the later years. There are also a group of authors starting to publish on ICWSM in 2016.
For CSCW, the patterns are opaquer, but for each year, from all the authors who published in previous years, more of them are coming from more recent years. For example, for all people who published on CSCW 2020 and early year’s CSCW, they are more likely to publish in 2019 than in 2018, and so far so on. This is indicated by the height of the rectangles shown in the figure.
To quantify these temporal patterns more precisely, I applied a temporal clustering on the number of papers for each author, aggregated by year. The time series k-means used Dynamic Time Wrapping as the distance metric—to consider the lagging effects of different time series. I manually checked the clustering results choosing the different number of clusters and eventually settled down on four.
Figure 7 shows the four clusters of authors, based on the temporal patterns of their publication records. The first cluster of authors has generally high productivity, especially during the early years; they were increasingly more prolific, and their productivity peaked around 2015. Cluster two is similar to cluster one—authors in this group maintained a stable number of publications before 2018 but not so much after that year. Cluster 0 shows a more sporadic pattern, while the productivity level was not high, and some specific years showed a high volume of publications. The last cluster is the opposite of cluster 1 and 2; authors who fall into this group had little to no publications before 2020. Their publication number took off in 2020 and is probably the newcomers to the ICWSM.
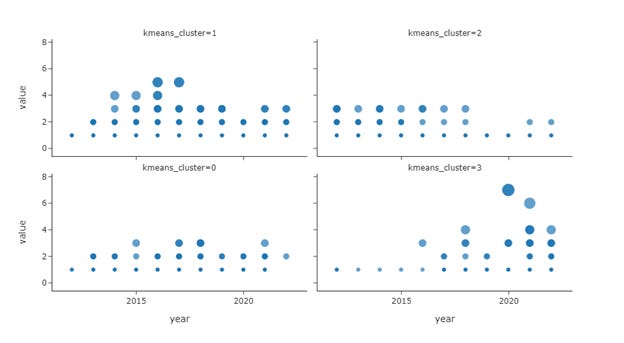
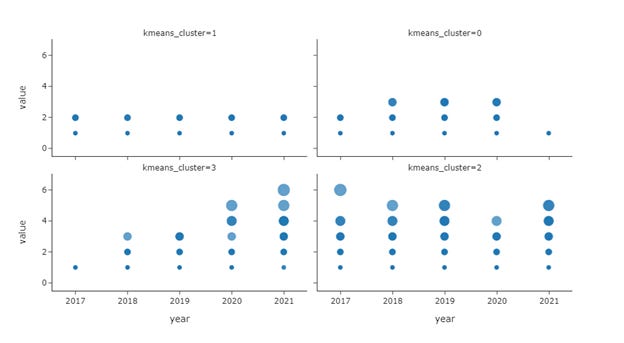
Figure 8 shows the four clusters derived from the CSCW dataset. Cluster 1 contains the authors who had relatively low publication counts throughout the years. These could be the one-time publishers for this avenue. Cluster 0 has higher publication activities with some authors publishing more than 2 papers in some years. Generally, this cluster indicates the authors who were more productive from 2018 to 2020. Cluster 3 shows an incremental trajectory of publication numbers across the years. The authors falling into this group didn’t have many publications from 2017 to 2019 but became very productive afterward. These are probably the new blood of CSCW. Cluster 4 is probably the evergreens that had at least high paper counts on one of the five years, especially 2017, 2019, and 2021.
Number of Papers per Author
Figure 9 illustrates the pattern of the number of papers per author. For both ICWSM and CSCW, the distribution follows a typical Poisson distribution: the majority of the authors only have 1 paper and it’s a rare event for one to have two or multiple papers.

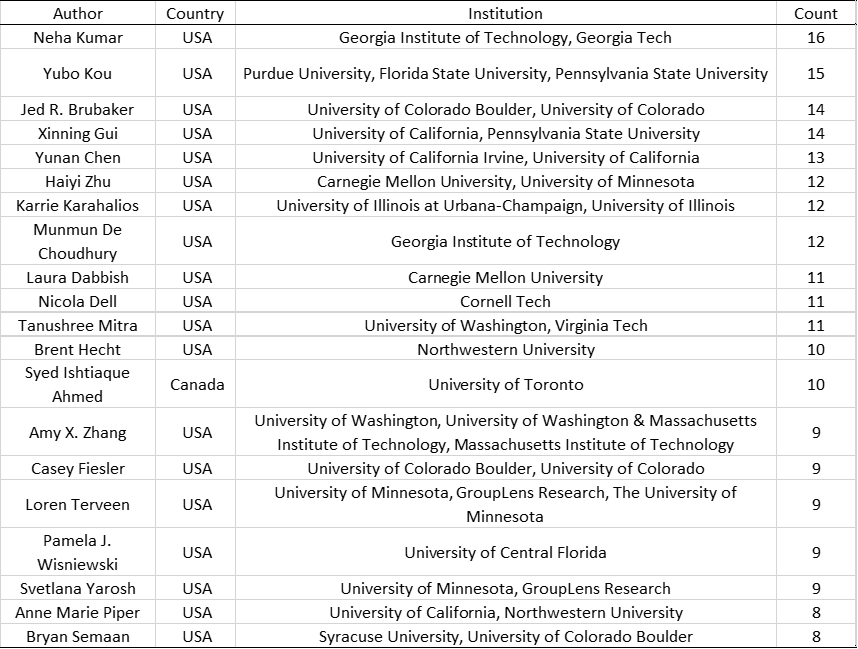
Tables below show the top 20 most productive authors for ICWSM and CSCW. For ICWSM, the most prolific author authored 19 times throughout the years; for CSCW the max number is 16.
Table 3 Most Productive Authors (ICWSM)
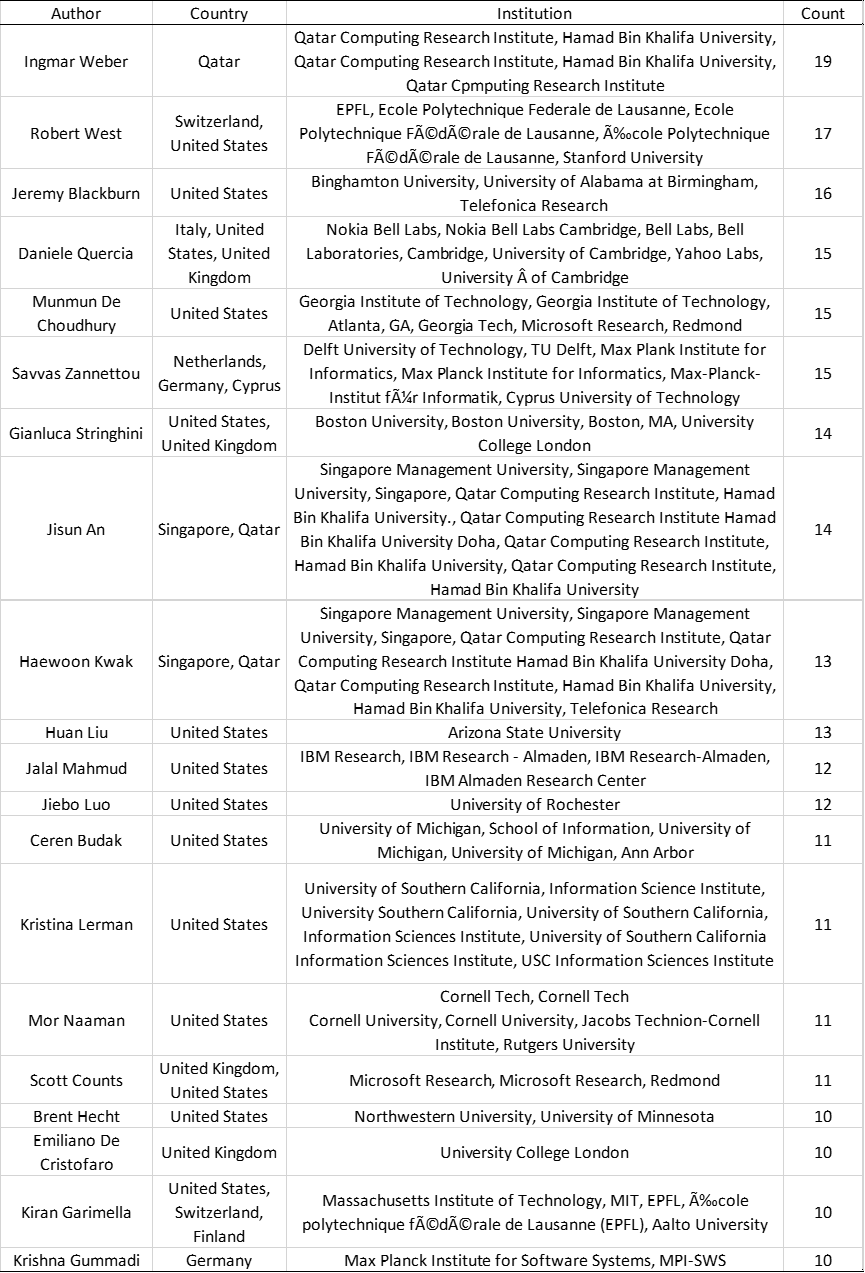
Table 4 Most Productive Authors (CSCW)
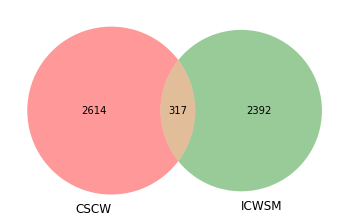
Overlap of CSCW and ICWSM Authors
Figure 10 shows how the overlapping of the scholars who published at the two conferences. Again, the matching is unrefined and strict and author names are not precisely cleaned, but we can still see a baseline of at least how many authors appeared in both proceedings. With a similar count of total authors, around 10% of the authors who ever published on ICWSM or CSCW also published on the other conference.
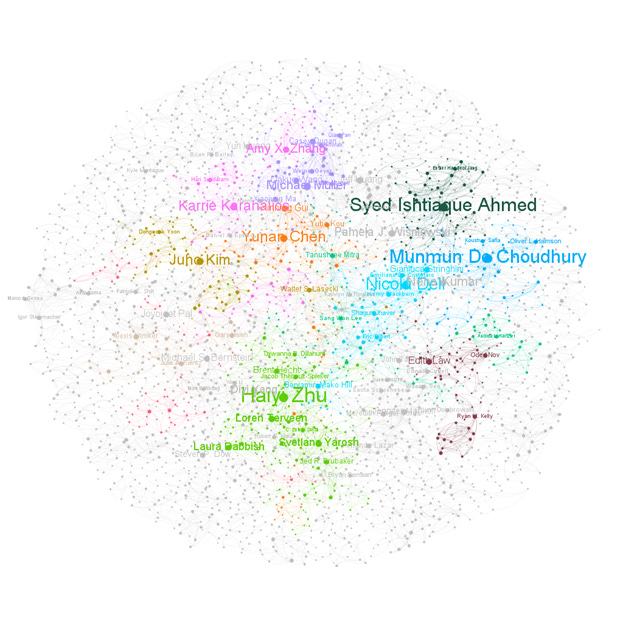
Coauthorship Network
I also constructed the co-authorship network for ICWSM and CSCW. Figure 11 is the visualization of ICWSM (N = 2992, E = 6447) and Figure 12 CSCW(N = 2914, E = 7550). The node size was scaled by degree, and label size by page rank; only nodes with degree centrality above 20 are shown with labels. This configuration was to highlight important authors for the conference. The color was the community detection results using modularity; nodes sharing the same color indicated that they were in the same community. Comparing ICWSM with CSCW, the ICWSM graph is less condensed with fewer edges but more nodes. Collaboration is more common for CSCW as it has a larger average degree, diameter, and average path length. The two networks have similar clustering coefficient and modularity scores, and both are very high, indicating the existence of scholar circles that closely coauthor together. Small world exists. Note that the network analysis could be a standalone piece, however, in this article, we only seek to unveil the general ideas about centrality and community here.

The following analysis was on the institution level. As mentioned above, the institution information from ICWSM is unstructured and many couldn’t find a country match from geocoding. Please only take a grain of salt when interpreting the findings and reading the graphics.
Number of Authors per Institution
Upscaling author information to the institution level, CSCW had published papers from 708 of 53 countries, ICWSM 875 and 48. Figure 13 shows the distribution of the number of authors within each institution who had published on ICWSM or CSCW. The distributions are generally long-tailed, and we see CSCW having more outliers with some institutions with a high number of authors.
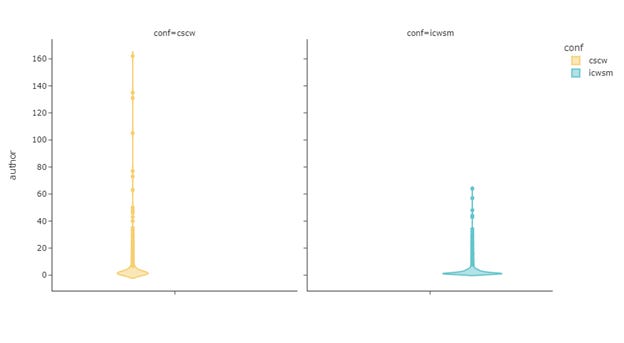
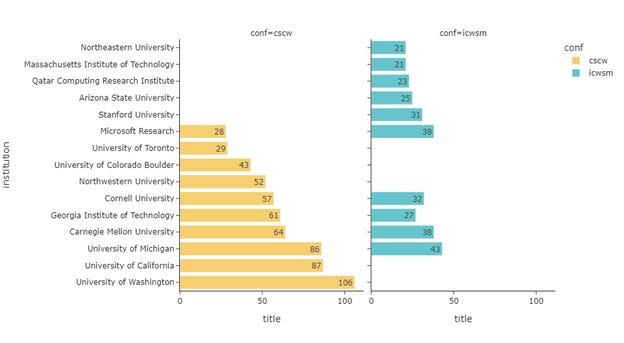
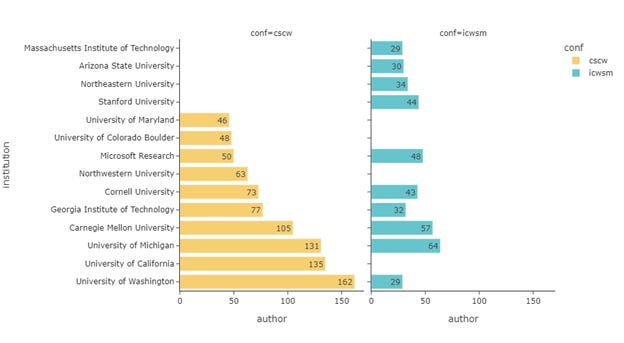
Figure 14 shows the top 10 institutions with the most authors and Figure 15 for the top 10 institutions with the most papers. The two rankings largely resemble each other, especially for the paper count per institution, where 6 of the top 10 institutions overlapped.
Spatial Distribution of Authors & Institution
Fig 16-18 shows the geospatial distribution of authors, and institutions, along with that of the papers. To make the data more comparable, I normalized the count data for each country to the percentages, so the plots are showing the proportion of papers/authors/institutions coming from each country. While both conferences are inclusive in the sense of having any authors where affiliation is non-U.S., the level of scientific production from the globe is still very US-centric or Euro-centric. Assuming the ICWSM data I geocoded was precise (which is not in reality), the comparison of the two somehow indicates that CSCW’s main source of publications comes from authors whose affiliation is based in the U.S.

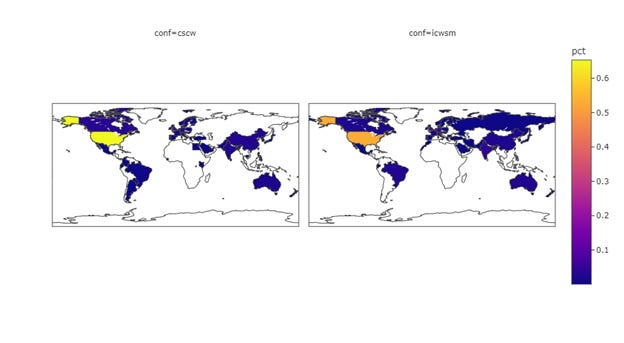
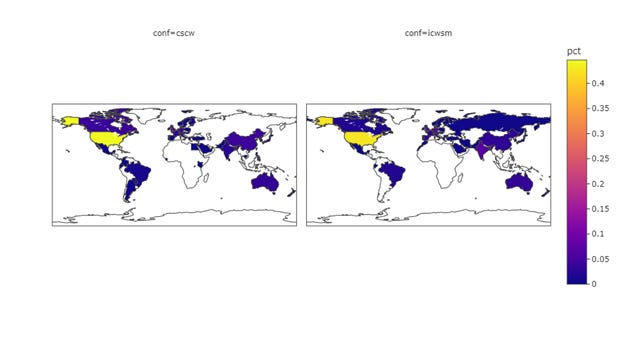
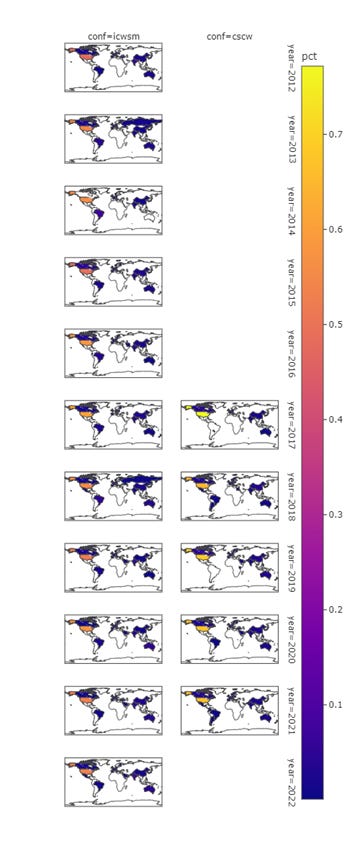
Figure 19 further addresses the temporal pattern of the spatial distribution of the authors. Generally, the spatial distribution of ICWSM is stable while the U.S. concentration is slowly decreasing. For CSCW, the trend is similar and more obvious. 2017 CSCW had the highest percentage of U.S. authors across all years for both CSCW and ICSWM, but it has plunged to a lower level in successive years. CSCW is slightly more US-centric than ICWSM for all years though the situation had been improving since 2017.
Keywords
Not every article has keywords listed on its article web page, which is the source of my web scraping. 493 articles fall into this category where no keywords metadata can be found. Most of them are coming from ICWM, including the entire dataset of ICWSM ’16, ’17, ’19, and ’20. I also acknowledge that CSCW has a hierarchical keywords system, which is disparate from the flat system used for ICWSM. Therefore, it might not be sensible to see the temporal trend of keywords breaking down by conference. Erring on the side of caution, I would also like to preface that the comparison of the two conferences in terms of keywords might not make sense. Nonetheless, we can still get a bird's eye view of the topics and their patterns.
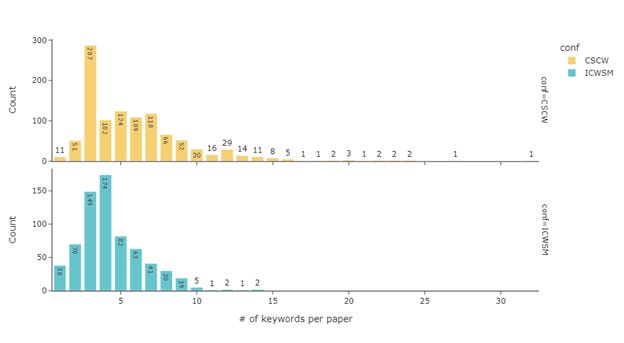
Number of Keywords per Paper
Figure 20 shows the number of keywords per paper. The majority of CSCW papers have three keywords while for ICWSM it is four. CSCW keywords are apparently more long-tailed though with a lot more papers having more than papers with more than five keywords.
Most Frequent Keywords
Figure 21 shows the top 15 most frequent keywords for CSCW based on document frequency, e.g., the proportion of all CSCW papers in the dataset that contains a specific keyword. The top keywords are rather generic here; this is mainly because these are top-level keywords in the system. Other popular keywords include interaction designs and several ones apropos to computing, including applied computing and social computing.

Figure 22 shows the keywords for ICWSM ranked by frequency. The keyword list carries a very strong text analysis flavor: text as the data source is represented all over the place, along with the analysis around text such as opinions, linguistics, sentiments, and such. Twitter is found to be the most popular social media for the research, which is very understandable and predictable. Reconogization, identification, and extraction are also common words, implying the nature of research is focused on pattern-finding and inductive.

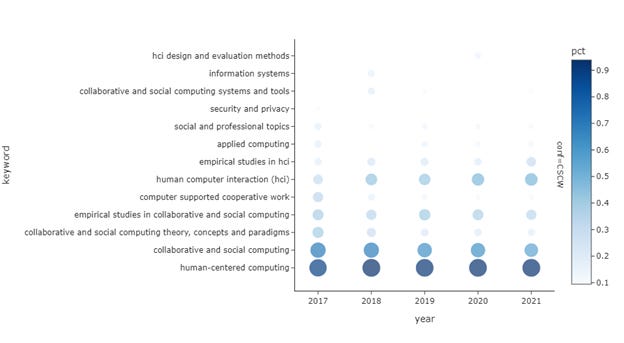
Figure 23 and Figure 24 show the top 10 keywords per year, and their prevalence. This is to see the evolution of the popularity of the keywords. For CSCW, fewer works were using CSCW and collaborative theory, concepts, and paradigms, but more just general HCI. ICWSM has more data samples, and because of its free-form keyword system used in the early years, the observable change is more abrupt. While Twitter has been popular for several years, Facebook, Wikipedia, and Flick seem to be a shadow of themselves. The only other social media on the list is Reddit, which only appeared in 2018.

Keyword Cooccurrence
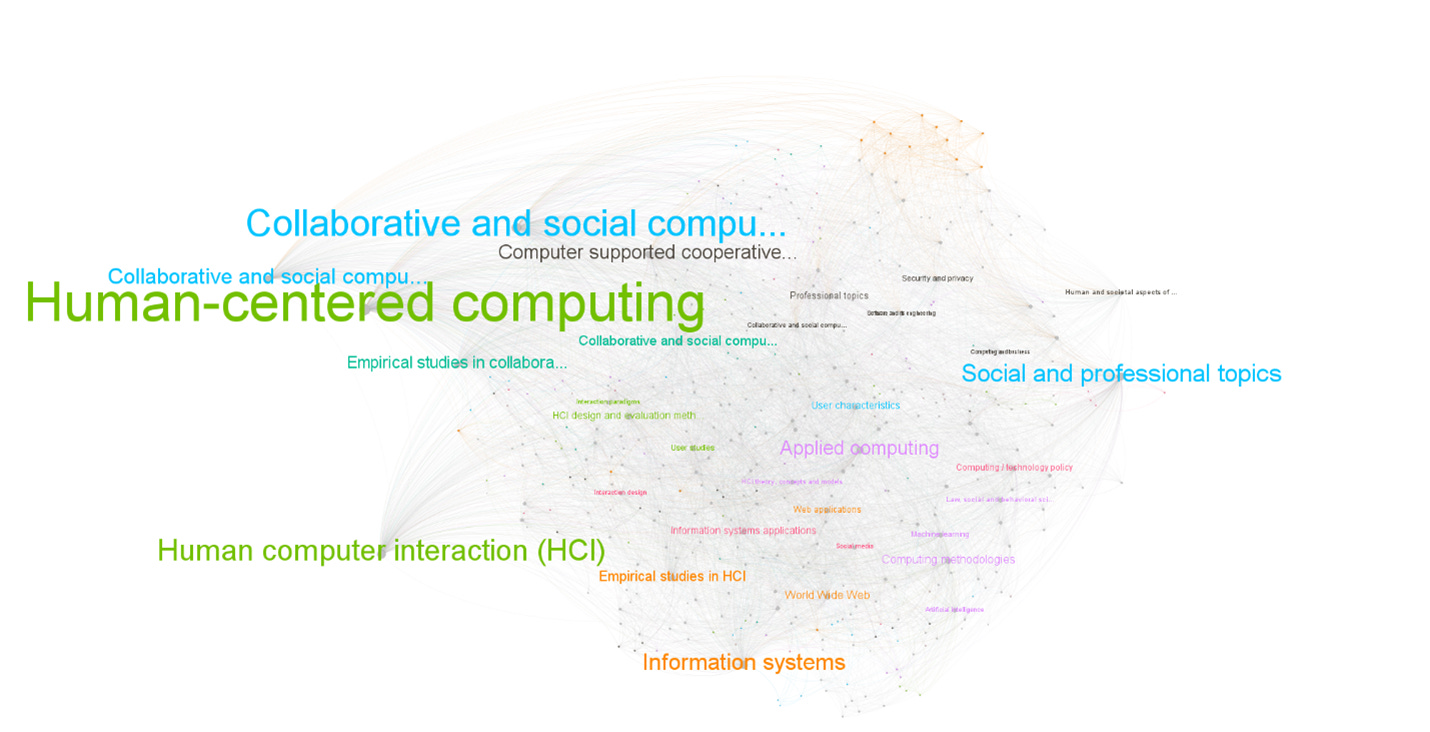
Lastly, I constructed the keyword co-occurrence networks; the nodes were scaled by degree and colored by communities detected by using modularity. Figure 25 shows the network for CSCW (N = 401, E = 6564) and Figure 26 for ICWSM (N = 1253, E = 4539). The CSCW network is a completed graph with one connected component—this is because the hierarchical keyword system only allows more specific keywords to be placed below a pre-defined generic top-level keyword. The clusters are vague to cut through their meanings, but it’s self-evident to see “empirical research in HCI”, “world wide web”, and “web applications” be grouped together. This group probably has a lot of papers that are more technical and focus on technologies. On the other hand, there are some clusters with a different focus. For example, the purple cluster seems to focus on the social aspect, and the green cluster on user and behavior topics.
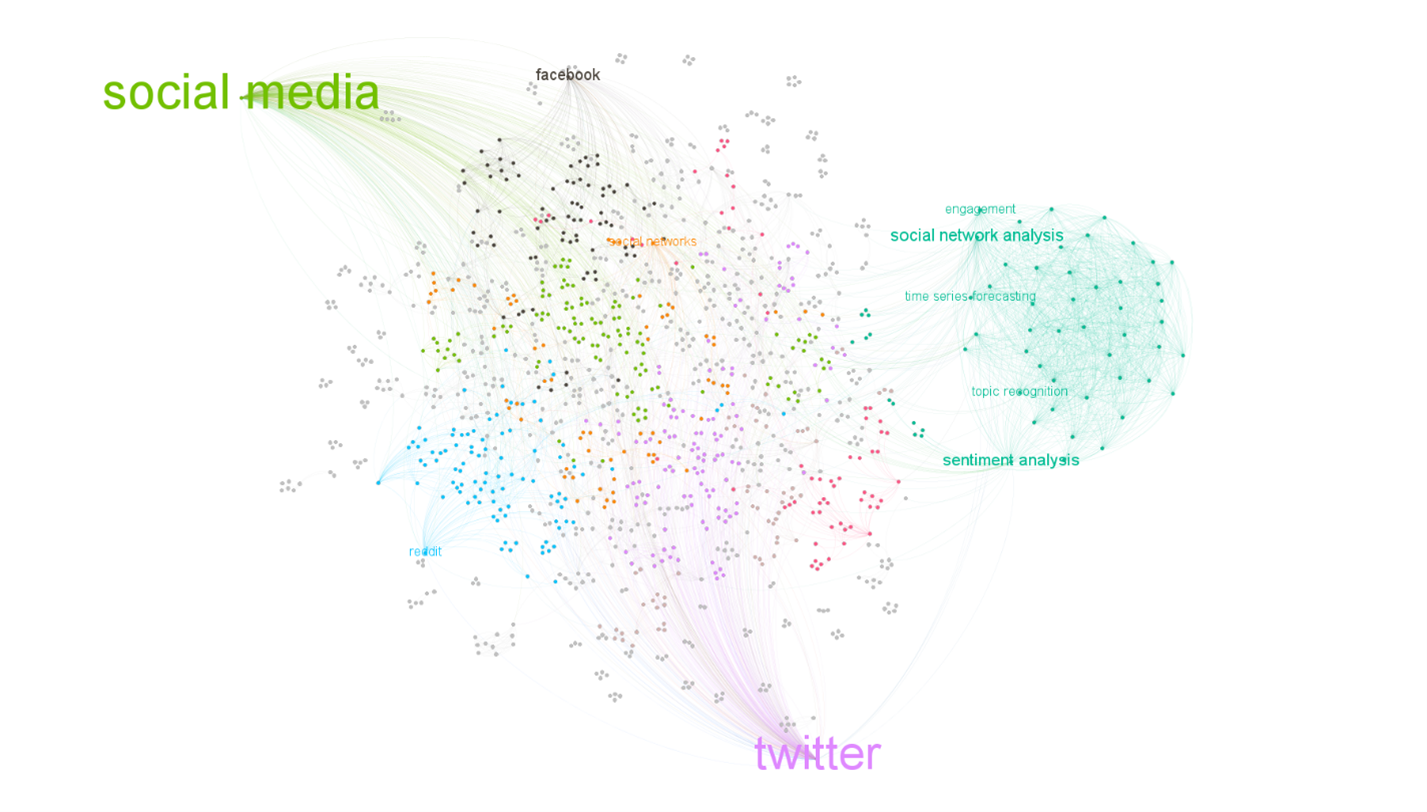
ICWSM network has a lot of islands—they are the paper that used some peculiar keywords that might not necessarily be used by other papers—that’s why the links are missing. We do see the clusters designation might be influenced by the type of social media used as the research target, for example, blue for Reddit and purple for Twitter. The dark green cluster stands out on its own with a strong methodological focus. The prominent keywords from this cluster are terms that describe the methods.
Usually, the posts I published on this Substack will end with a takeaway section for findings, however, for this post, I decided to leave this part to the readers. You should be the one pondering what’s the takeaway from this. Compared with every scholar that has been in this field and dedicated for years, I’m just trying to peek at it. This post is not intended to be informative on the knowledge level, but also just on the information level. That is to say, you can be informed by the publication pattern that the field is still very US-centric, but it could also be as simple as benefiting to know that the University of Washington is the most productive institution on CSCW. Again, as I have jotted down above that the data is not ideal and my approach is simple, as it is just a personal analysis to share. I hope you also take caution on looking at the graphs and my interpretations.
References
Borgman, Christine L., and Jonathan Furner. “Scholarly Communication and Bibliometrics.” Annual Review of Information Science and Technology, vol. 36, no. 1, 2002, pp. 2–72. Wiley Online Library, https://doi.org/10.1002/aris.1440360102.
Harzing, Anne-Wil. “Citation Analysis across Disciplines: The Impact of Different Data Sources and Citation Metrics.” Scientometrics, vol. 106, no. 2, 2010, pp. 787–804.